The US Economy, Week of Nov 9-13, 2026: Where the Cycle Stands

I track the US economy each week through the indicators that the Federal Reserve publishes: inflation, interest rates and the yield curve, jobs and layoffs, credit spreads, mortgage rates, consumer sentiment and GDP. Each chart covers the last three years of data from FRED, one metric per chart.
Glossary: what the terms mean
- Inflation (CPI): How much more things cost than a year ago. The Consumer Price Index measures inflation with a basket of groceries, gas, rent and everyday goods.
- Core inflation: The same measure with food and fuel removed. Food and fuel prices change a lot from month to month, so core shows the slower, stickier trend.
- 3-month annualized pace: Inflation over just the last three months, converted to a yearly rate. The 3-month pace changes direction before the year-over-year number does, so the 3-month pace gives an early warning.
- Fed rate (fed funds): The short-term interest rate the Federal Reserve sets. Lenders set mortgage, car loan and credit card rates from the Fed rate. A higher Fed rate slows the economy. A lower Fed rate stimulates the economy.
- Treasury yield (2-year, 10-year): The interest rate the US government pays to borrow for 2 or 10 years. The 2-year tracks where markets expect the Fed rate to go. The 10-year reflects longer-run growth and inflation.
- Basis point (bp): One hundredth of a percentage point. 50bp = 0.50%.
- Yield curve: The 10-year rate minus the 2-year rate. The yield curve is normally positive, because a longer loan pays more.
- Inverted curve: A yield curve below zero. Investors accept less to lend for 10 years than for 2, which they only do when they expect a slowdown. An inverted curve came before every US recession in the last 50 years, usually about a year early, and an inverted curve also gave false alarms.
- Unemployment rate: The share of people who want a job, search for one, and don't have one.
- Payrolls (jobs added): The net number of jobs employers added in a month.
- Participation rate: The share of working-age adults who have a job or actively search for one. If people quit the job search, the unemployment rate can fall even though nobody found a job. The participation rate shows when people quit the job search.
- Sahm rule: A recession alarm that FRED publishes as the Sahm Rule Recession Indicator. When the 3-month average unemployment rate rises half a point above its low of the past year, the US economy is almost always already in a recession.
- Jobless claims: The number of people who file for unemployment benefits for the first time each week. Jobless claims are the fastest weekly data on layoffs.
- High-yield credit spread: The extra interest risky companies pay to borrow compared with the government. The posts use the ICE BofA US High Yield spread. A low spread means lenders see little risk. A sharp rise in the spread means lenders see more risk.
- 30-year mortgage rate: The interest rate on a typical home loan.
- Consumer sentiment: A monthly University of Michigan survey of how people feel about their finances and the economy.
- GDP growth: How fast the total output of the economy grows, after inflation, at a yearly pace. The Bureau of Economic Analysis reports GDP growth every quarter and revises the number later.
- WTI oil: The benchmark price of a barrel of US crude oil. The WTI price moves gas prices and CPI inflation quickly.
- Recession: A broad, sustained decline in economic activity: lower output, higher unemployment, weaker spending.
- Soft landing: The Fed lowers inflation, and no recession follows.
- Base, bear and bull case: The most likely path, the worse path, and the better path over the next year, each with a rough probability.
This week's read
A large language model (LLM) generates the analysis below from the Federal Reserve data in the charts. The analysis is not financial advice.
The call this week is MID/LATE-CYCLE: CAUTION. October CPI came in hot: prices rose 0.35% in the month and the 3-month pace climbed to 5.7%. Oil fell to about $90 and spreads eased. The 2-year yield jumped and the curve flattened to +25bp. The late-cycle call holds and the odds are unchanged.
Inflation
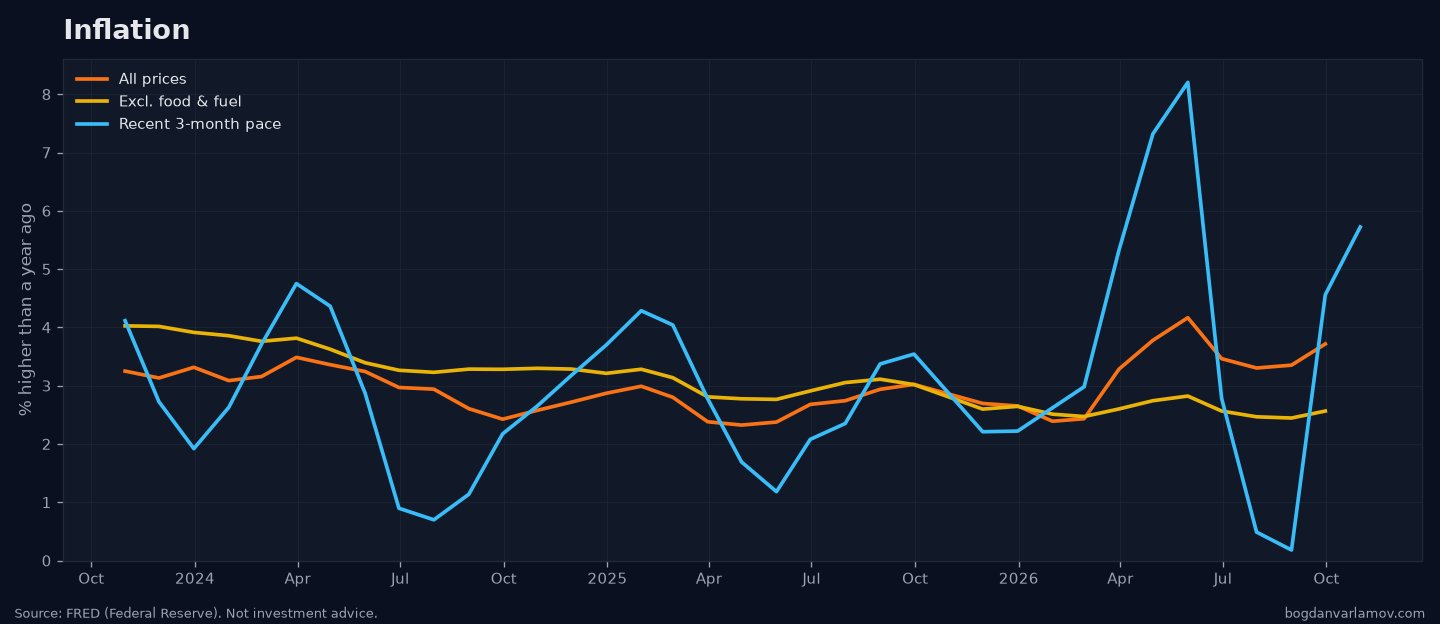
Headline and core inflation, and the recent 3-month pace.
Oil, the input that moves headline inflation fastest.
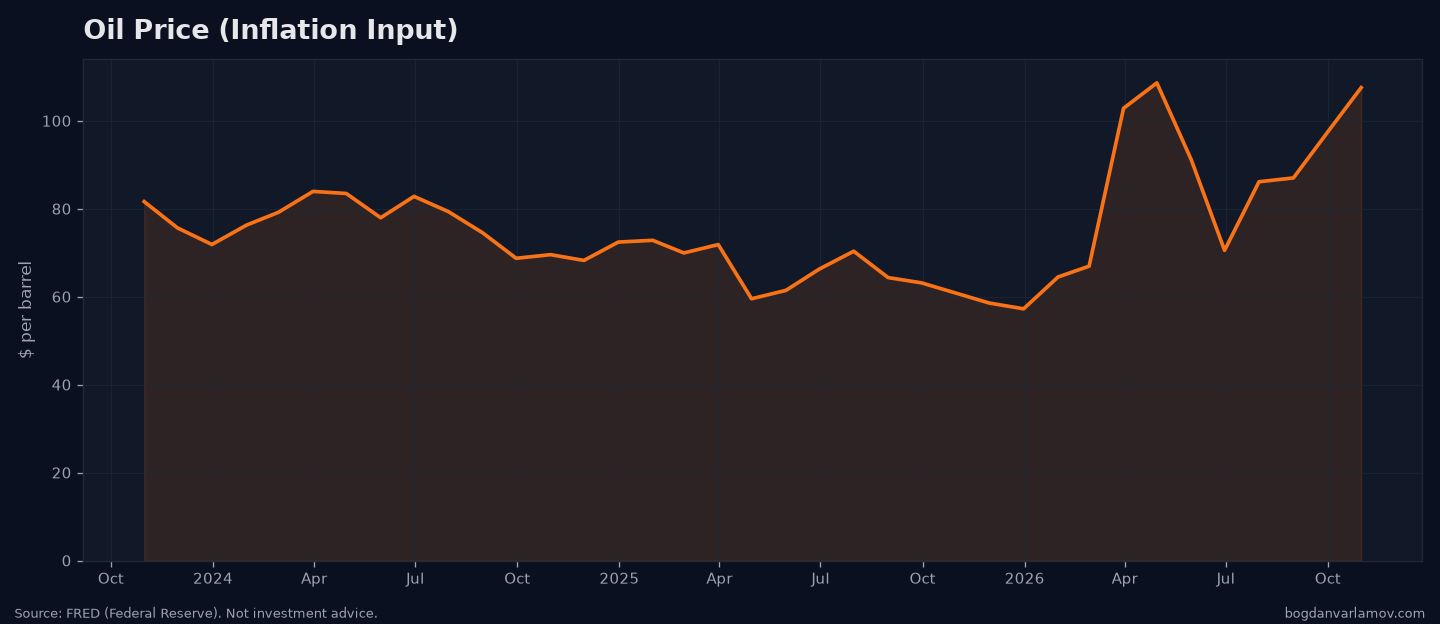
October CPI arrived. Headline prices rose 0.35% in the month, after 0.65% in September, and the 3-month annualized rate rose to 5.7% from 4.6%. Core prices rose 0.30%, a 3-month pace of about 3.75%. There is no official year-over-year figure, because no October 2025 CPI was published. Against the September and November 2025 levels, headline is roughly 4.0% and core roughly 2.8% (core was 2.6% in September). Oil was October's driver, as expected. WTI has since fallen from $99.64 (Nov 3) to $89.62 (Nov 10), so November's reading has a chance to cool.
Rates and the Fed
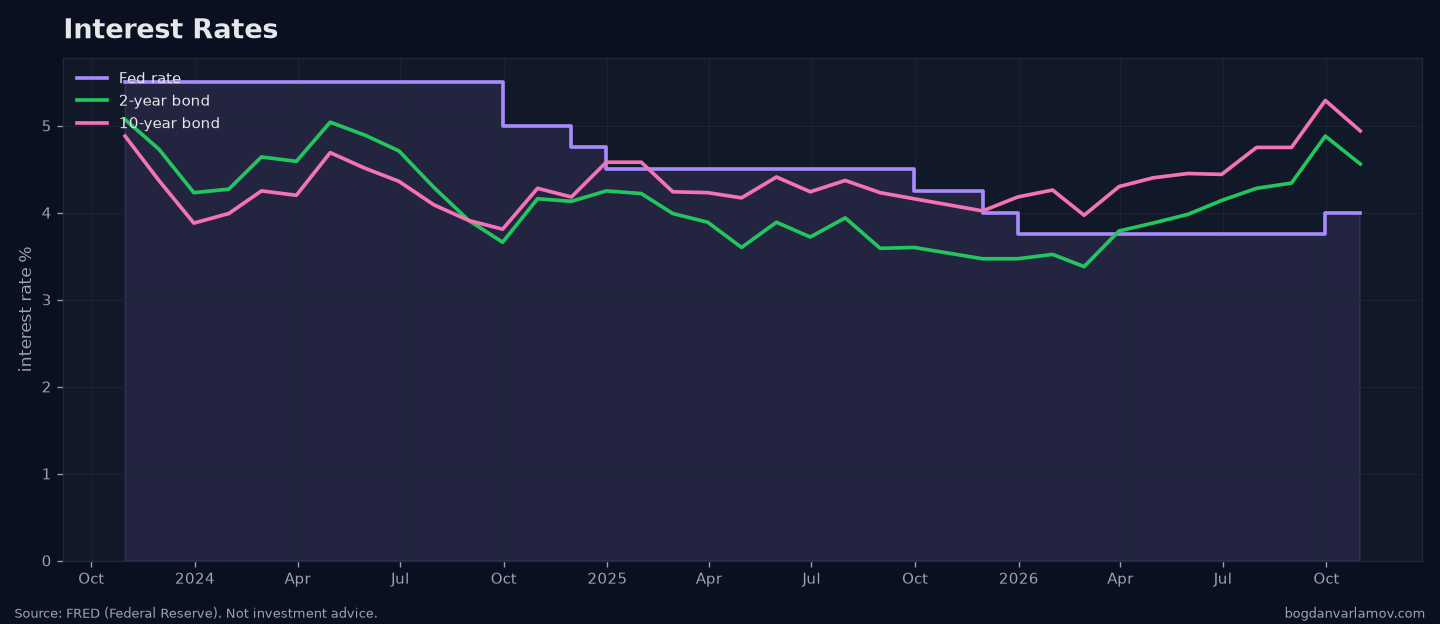
The Fed rate against the 2- and 10-year bond.
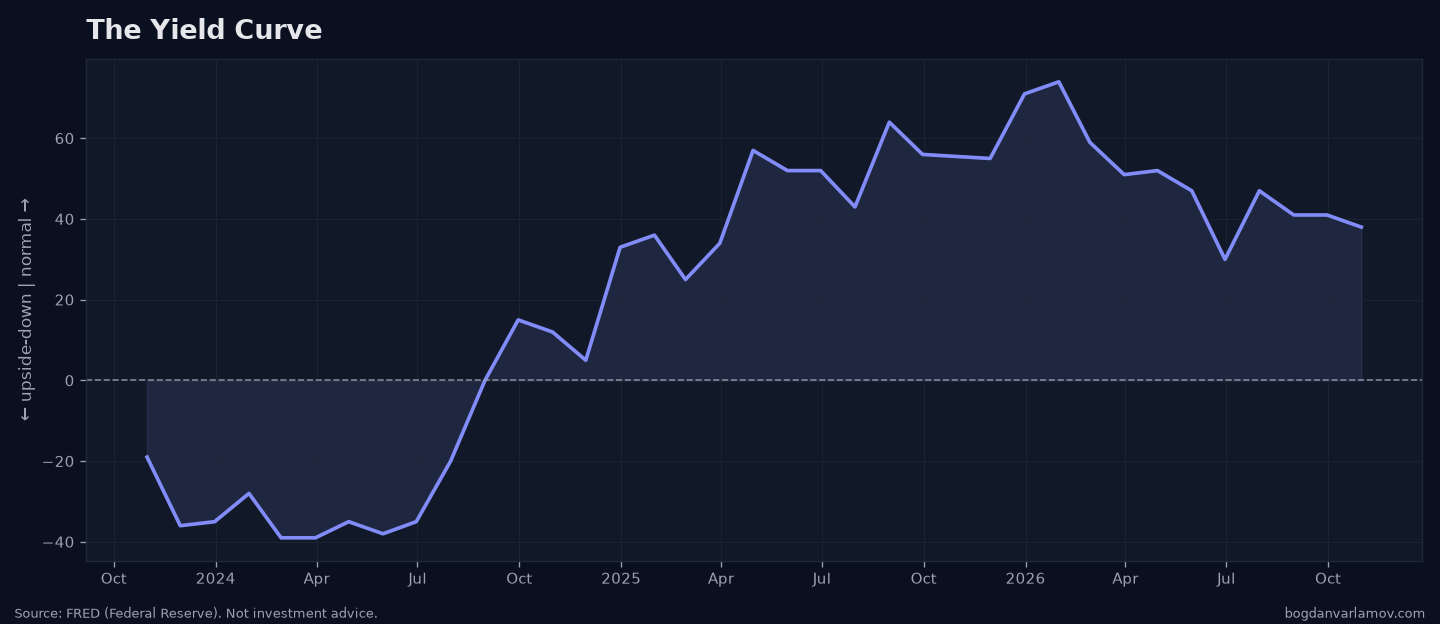
The yield curve (10-year minus 2-year).
The 30-year mortgage rate, where higher rates reach households.
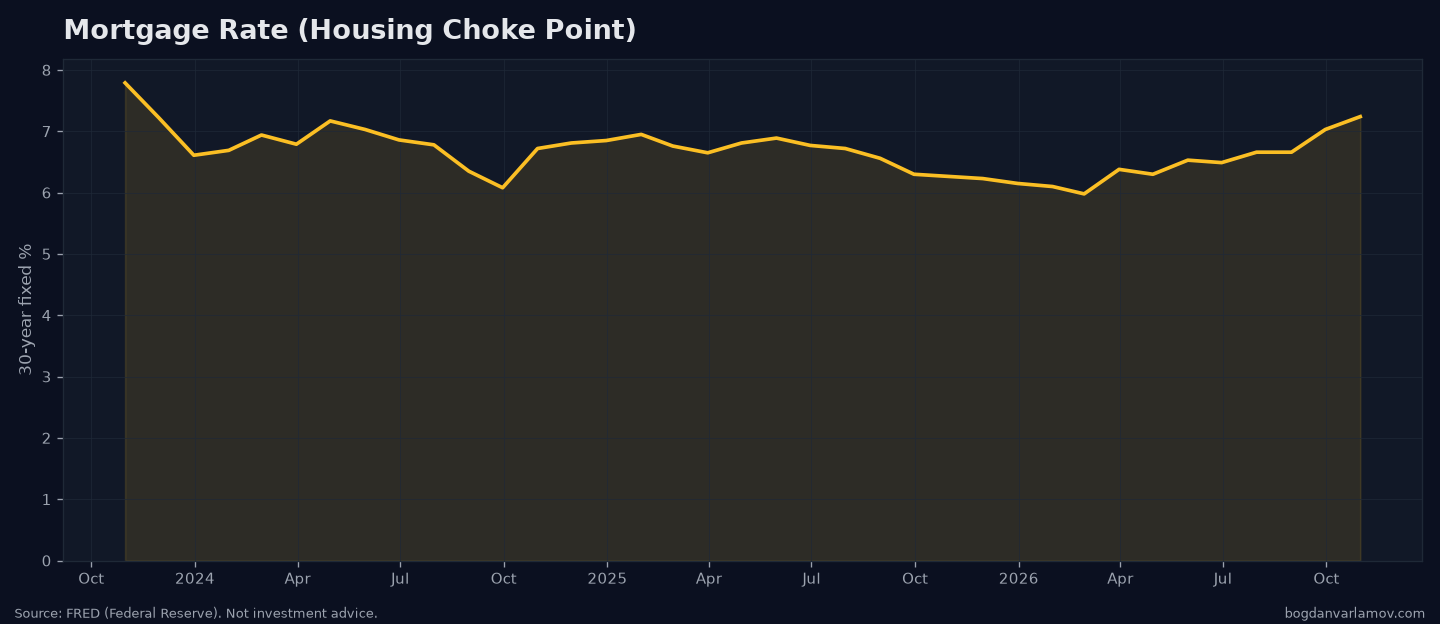
The Fed's upper target is still 4.00%. The 2-year yield rose from 4.58% (Nov 4) to 4.73% (Nov 10), with 17bp of that on Nov 10 alone. The 10-year rose less, from 4.90% to 4.98%. The 10y-2y gap narrowed from about +32bp to about +25bp. Over three months it has gone from +47bp to the mid-20s. It is still positive. The 30-year mortgage rate eased to 7.11% (Nov 12) from 7.18%.
The labor market
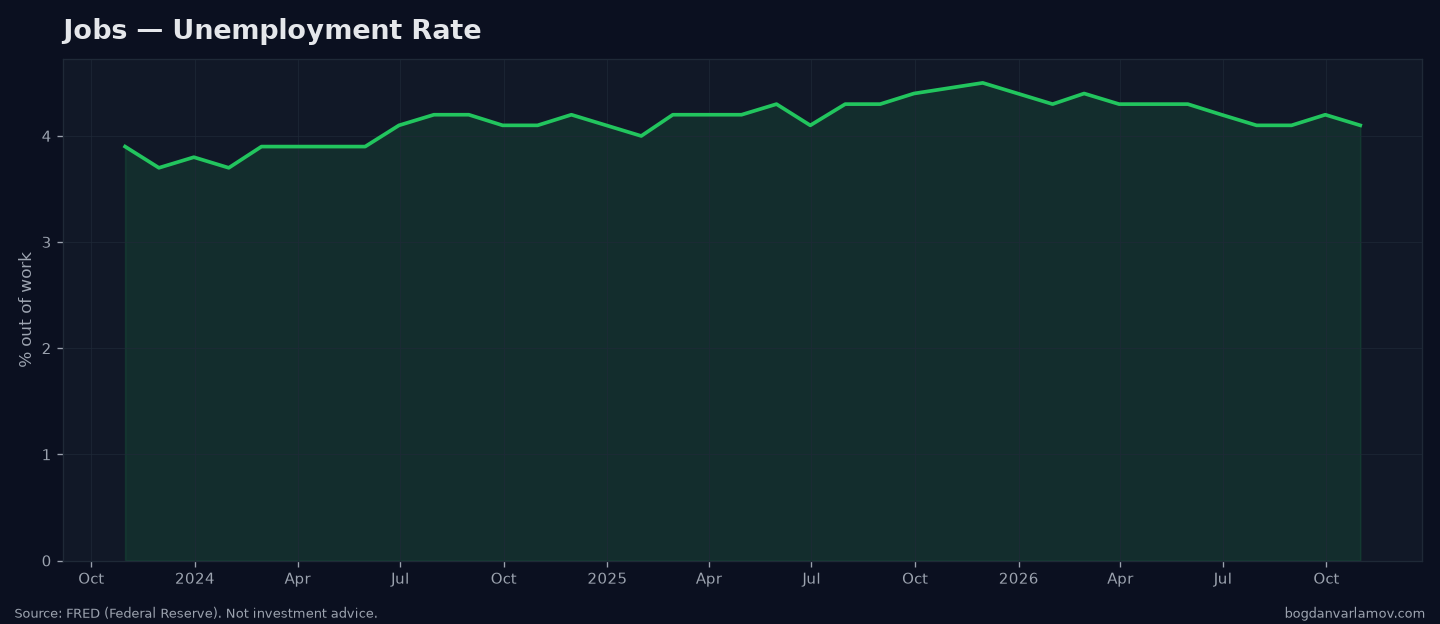
Unemployment.
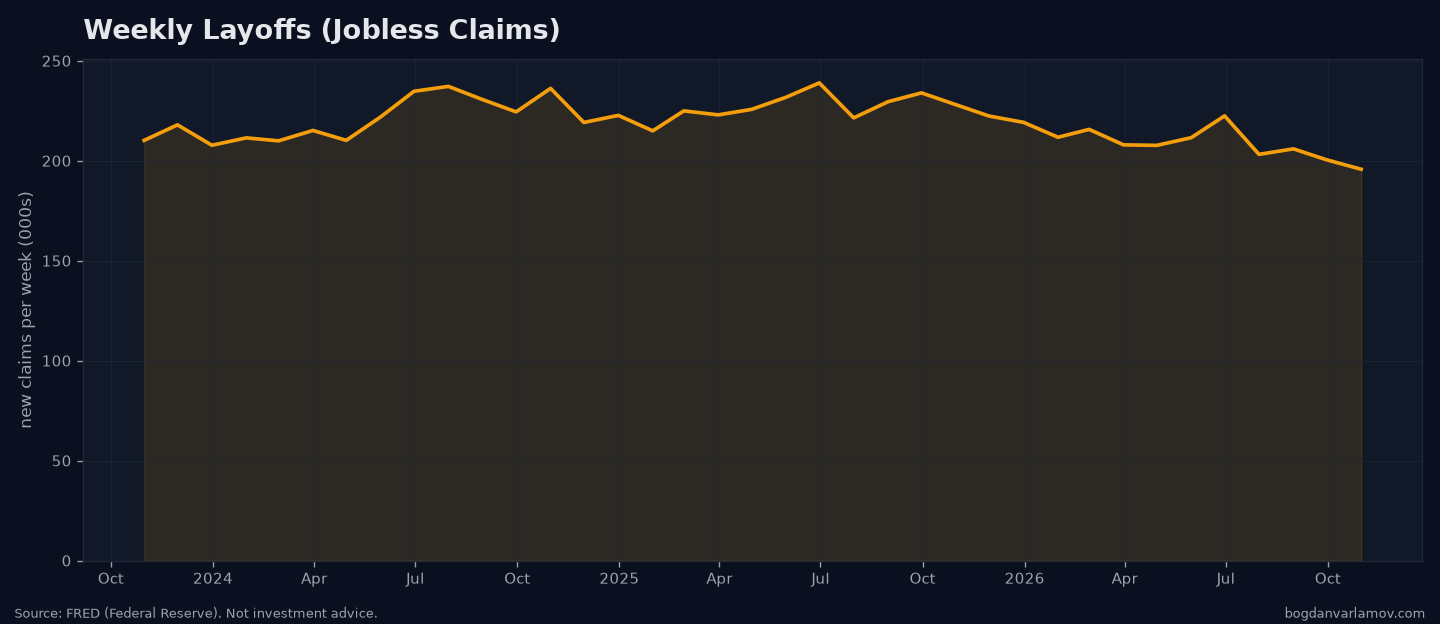
Weekly jobless claims, the fastest job-market signal there is.
No new jobs report this week, so October stands: +165k payrolls, unemployment 4.1% and participation 61.9%. Unemployment is down from 4.5% in November 2025. The Sahm rule does not trigger: the 3-month unemployment average (~4.13%) is at its 12-month low.
Forward-looking stress gauges
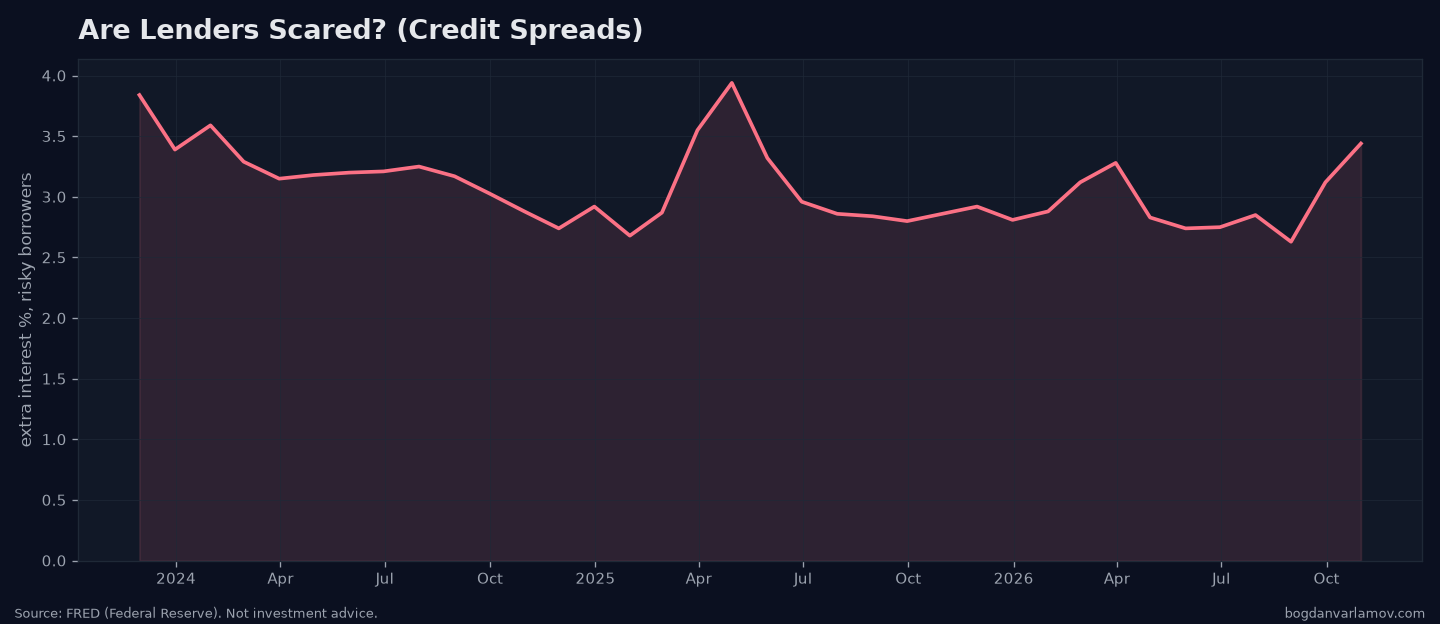
High-yield credit spreads, the fear gauge for lenders.
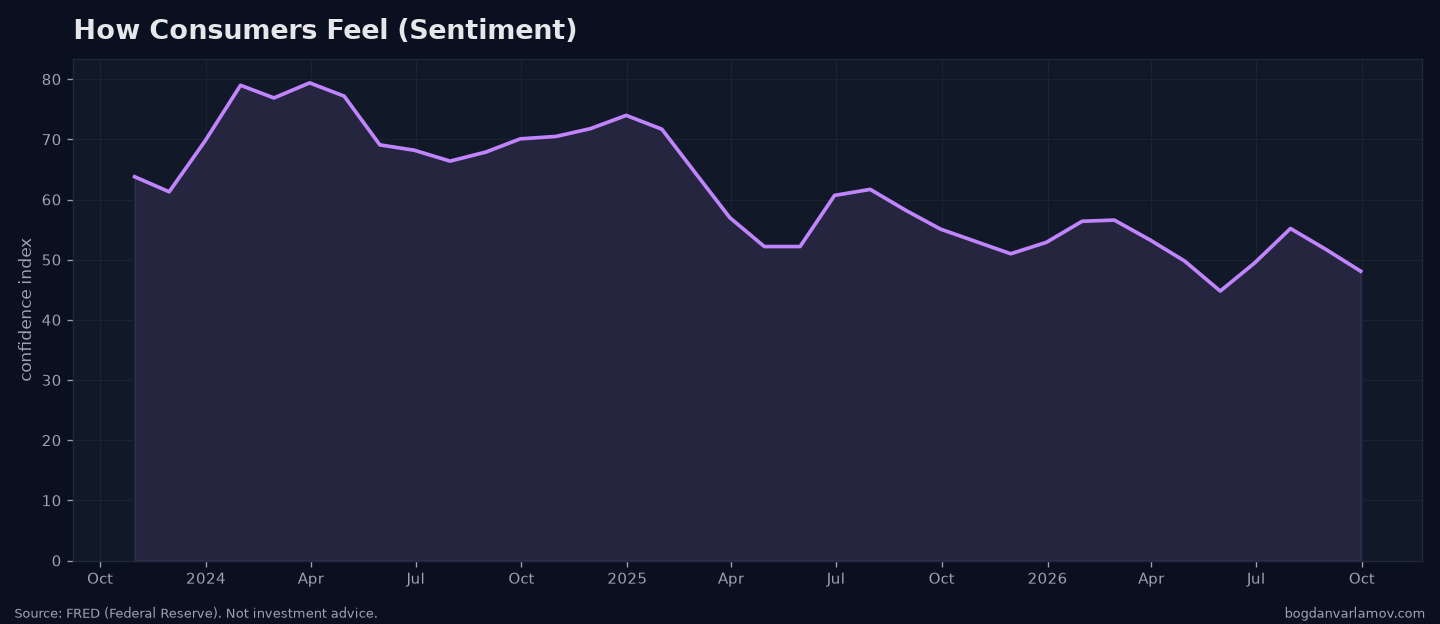
Consumer sentiment, which leads spending.
GDP growth, the last of these figures to arrive.
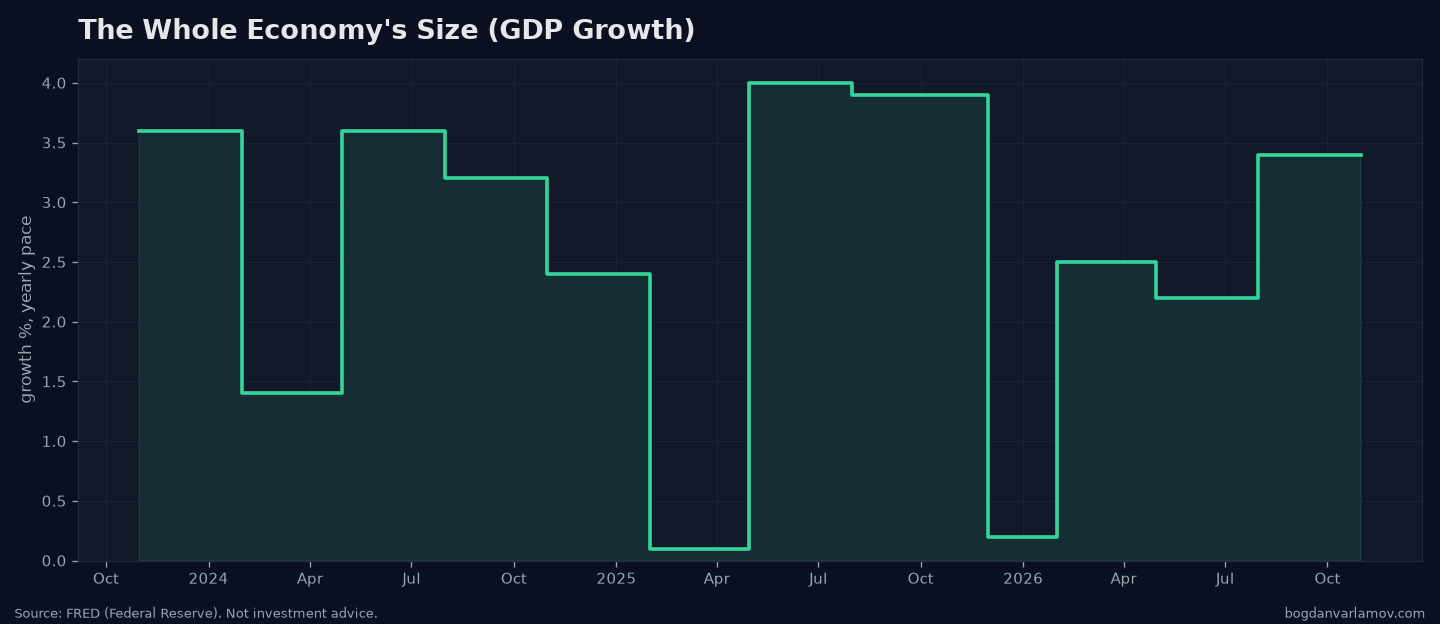
Claims rose and credit eased. Weekly jobless claims for the week of Oct 31 were revised to 191k from the 189k first reported, and the latest week (Nov 7) is 200k. The 200k matches the Oct 10 reading and is far below the ~260k tripwire. High-yield spreads narrowed to 3.20% (Nov 12) from 3.48% (Nov 5), back near where they were in late October. Financial conditions (NFCI −0.46) are still loose and have tightened slowly every week since early September. Q3 GDP was 3.4%. Households still feel rates and energy more than layoffs (real disposable income growth 0.95%, savings rate 3.8%).
The next twelve months
The model puts rough odds on each path below. The odds are the model's judgment.
Base case (~55%): Muddle-through / soft landing. The model holds this at ~55%. Growth is positive (Q3 GDP 3.4%), the job market is steady (+165k in October, unemployment 4.1%) and claims are low at 200k. The hot October CPI was the risk this case already carried: with a 5.7% 3-month pace and the 2-year at 4.73%, the Fed at 4.00% has little room to cut. Oil back near $90 suggests that the inflation pressure peaked with October.
Bear case (~25%): Consumer-led / rate-squeeze recession. The model holds this at ~25%. The squeeze tightened at the short end: the 2-year rose 15bp in the week and the curve flattened to ~+25bp, from +47bp three months ago. Claims rose to 200k. Spreads fell back to 3.20%, mortgage rates eased to 7.11% and cheaper oil helps household budgets. The tripwires are claims above ~260k and a yield curve inversion, and neither is close.
Bull case (~20%): Re-acceleration. The model holds this at ~20%. One of its two conditions is now about met: oil is at $89.62, right at the ~$90 line. The other condition is not met: October's 3-month CPI pace rose to 5.7% and core to about 3.75%, so inflation is not heading back toward 2% yet. The case needs oil to stay low long enough to show up in November and December CPI.
What to watch next
These tripwires would change the call:
- Yield curve inversion (10y-2y below 0): ~+25bp on Nov 10, down from ~+32bp last week and +47bp three months ago. The curve is not close to inversion. The gap is narrowing.
- Weekly jobless claims above ~260k and staying there: latest 200k (Nov 7), up from 191k (revised from 189k). Claims are not close to the tripwire.
- Sahm rule (3-month unemployment average 0.5pp above its 12-month low): ~4.13%, at its low. The gap is 0pp. The November jobs report is next.
- Oil holding above ~$95: latest $89.62, down from $99.64 last week. Oil is now below the line. November CPI will show whether it reaches prices.
- High-yield spreads rising through ~4% to 5%: 3.20%, down from 3.48% last week.