The US Economy, Week of Oct 12-16, 2026: Where the Cycle Stands

I track the US economy each week through the indicators the Federal Reserve publishes: inflation, interest rates and the yield curve, jobs and layoffs, credit spreads, mortgage rates, consumer sentiment and GDP. Each chart covers the last three years of data from FRED, one metric per chart.
Glossary: what the terms mean
- Inflation (CPI): How much more things cost than a year ago, measured by the Consumer Price Index: a basket of groceries, gas, rent and everyday goods.
- Core inflation: The same measure with food and fuel removed. Those two swing a lot month to month, so core shows the slower, stickier trend.
- 3-month annualized pace: Inflation over just the last three months, converted to a yearly rate. It turns before the year-over-year number does, so it is the early warning.
- Fed rate (fed funds): The short-term interest rate the Federal Reserve sets. Lenders set mortgage, car loan and credit card rates from it. A higher Fed rate cools the economy. A lower Fed rate stimulates the economy.
- Treasury yield (2-year, 10-year): The interest rate the US government pays to borrow for 2 or 10 years. The 2-year tracks where markets expect the Fed rate to go. The 10-year reflects longer-run growth and inflation.
- Basis point (bp): One hundredth of a percentage point. 50bp = 0.50%.
- Yield curve: The 10-year rate minus the 2-year rate. Normally positive, because a longer loan pays more.
- Inverted curve: When the yield curve drops below zero. Investors accept less to lend for 10 years than for 2, which they only do when they expect a slowdown. An inverted curve came before every US recession in the last 50 years, usually about a year early. It also gave false alarms.
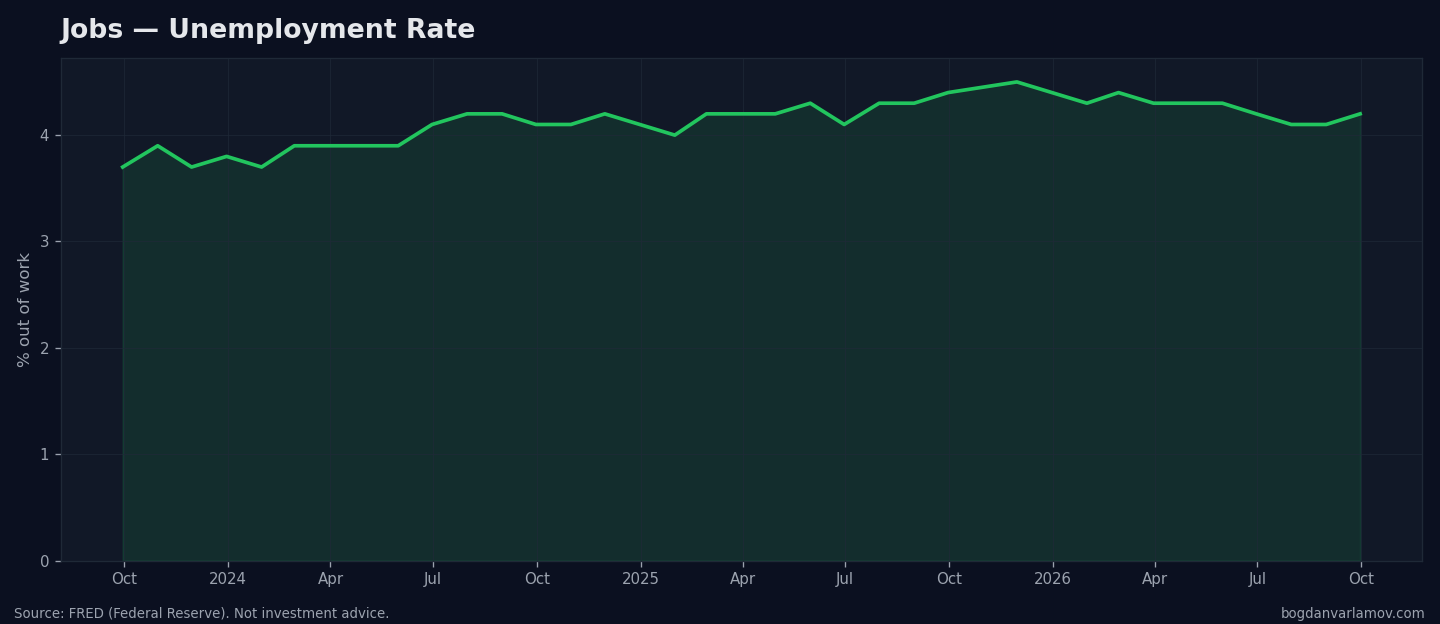
- Unemployment rate: The share of people who want a job, search for one, and don't have one.
- Payrolls (jobs added): The net number of jobs employers added in a month.
- Participation rate: The share of working-age adults who have a job or actively search for one. If people quit the job search, unemployment can fall for the wrong reason. The participation rate shows when that happens.
- Sahm rule: A recession alarm. When the 3-month average unemployment rate rises half a point above its low of the past year, a recession has almost always already started.
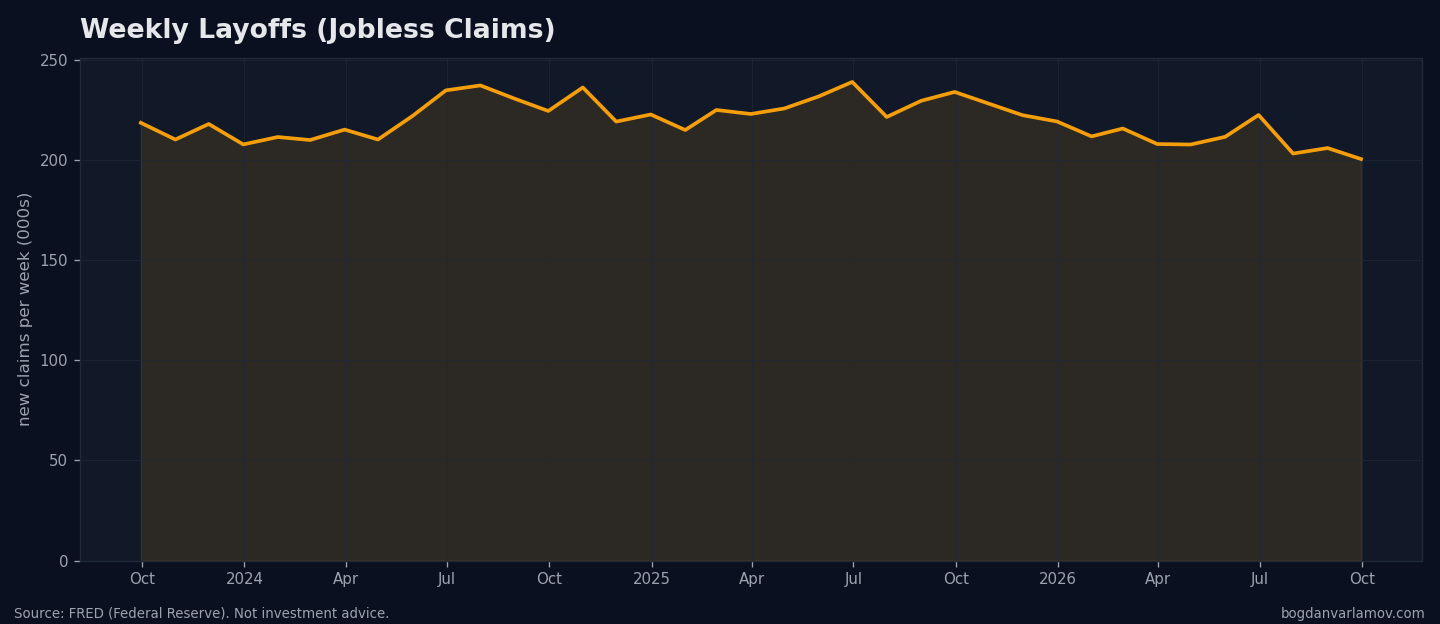
- Jobless claims: The number of people who file for unemployment benefits for the first time each week. The fastest read on layoffs.
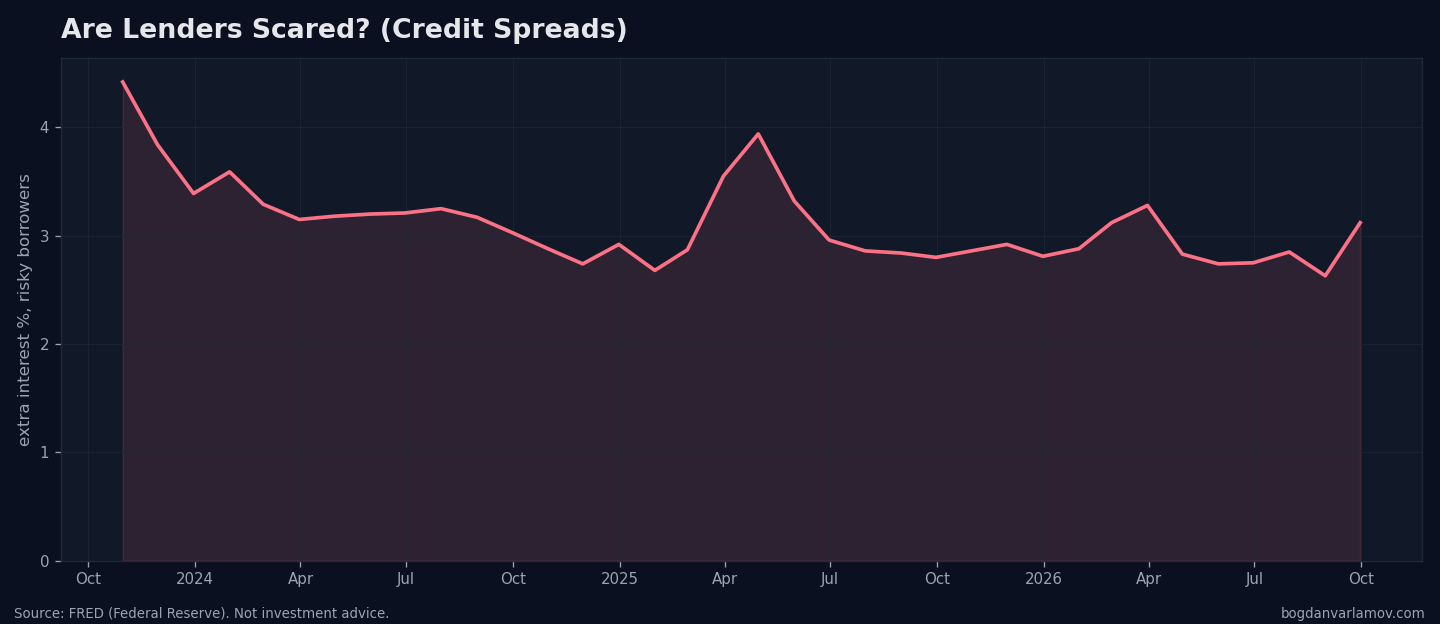
- High-yield credit spread: The extra interest risky companies pay to borrow compared with the government. A low spread means lenders are relaxed. A sharp rise means lenders are nervous.
- 30-year mortgage rate: The interest rate on a typical home loan. Above roughly 7%, many buyers can no longer afford a home, and construction slows.
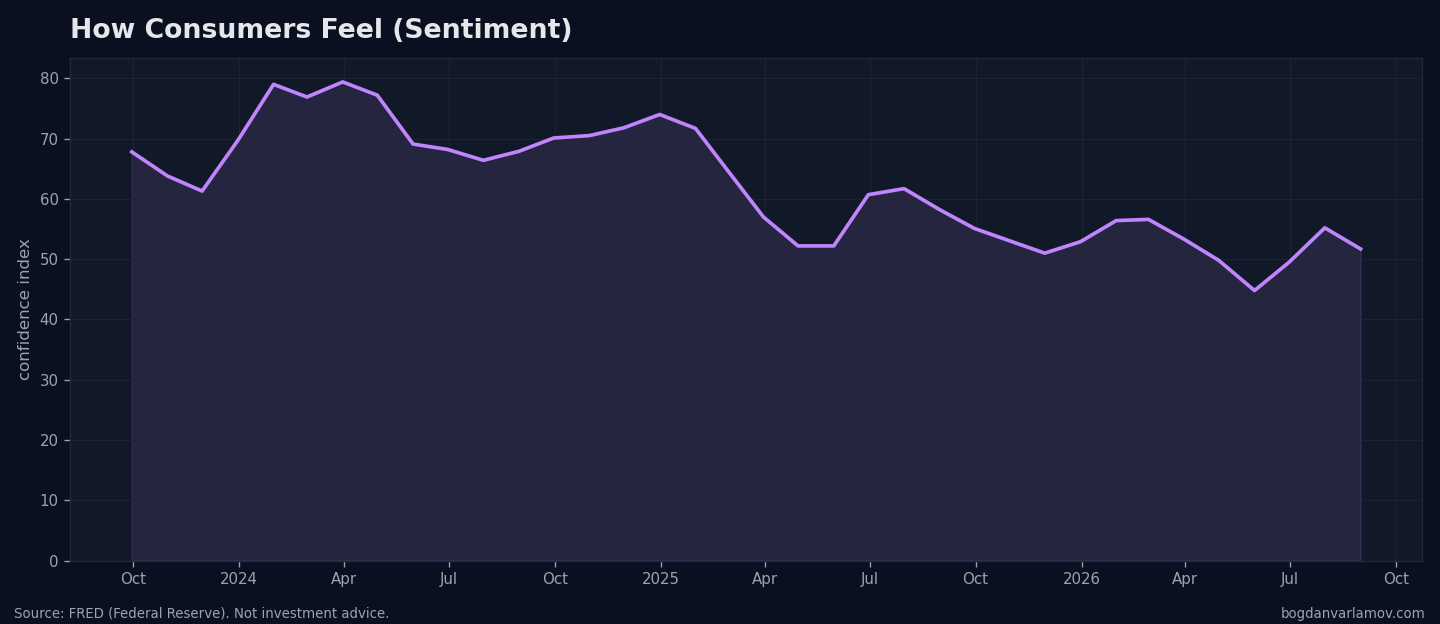
- Consumer sentiment: A monthly University of Michigan survey of how people feel about their finances and the economy. Readings in the 50s match historical recession levels.
- GDP growth: How fast the total output of the economy grows, after inflation, at a yearly pace. The government reports it every quarter and revises it later.
- WTI oil: The benchmark price of a barrel of US crude oil. It moves gas prices and headline inflation quickly.
- Recession: A broad, sustained decline in economic activity: lower output, higher unemployment, weaker spending.
- Soft landing: The Fed lowers inflation, and no recession follows.
- Base, bear and bull case: The most likely path, the worse path, and the better path over the next year, each with a rough probability.
This week's read
A scheduled Kiro Crew job generates the analysis from here down. The job uses the claude-opus-5.5 model at default reasoning effort. It works only from the Federal Reserve data in the charts. Check its reading against them.
The call this week is MID/LATE-CYCLE, with caution. The economy is steady and late in the cycle. Inflation rose again, and headline CPI led the rise. Rates rose sharply, and the Fed moved tighter. No recession trigger has fired.
Inflation
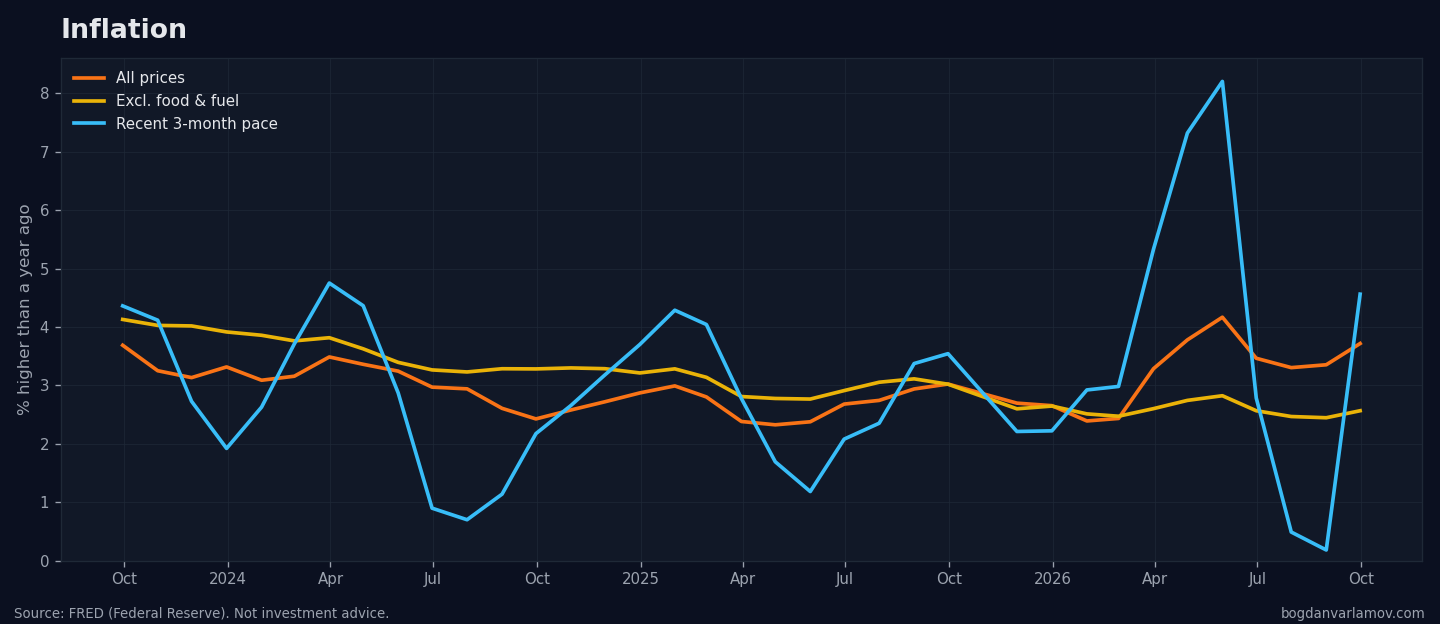
Headline and core inflation, and the recent 3-month pace.
Oil, the input that moves headline inflation fastest.
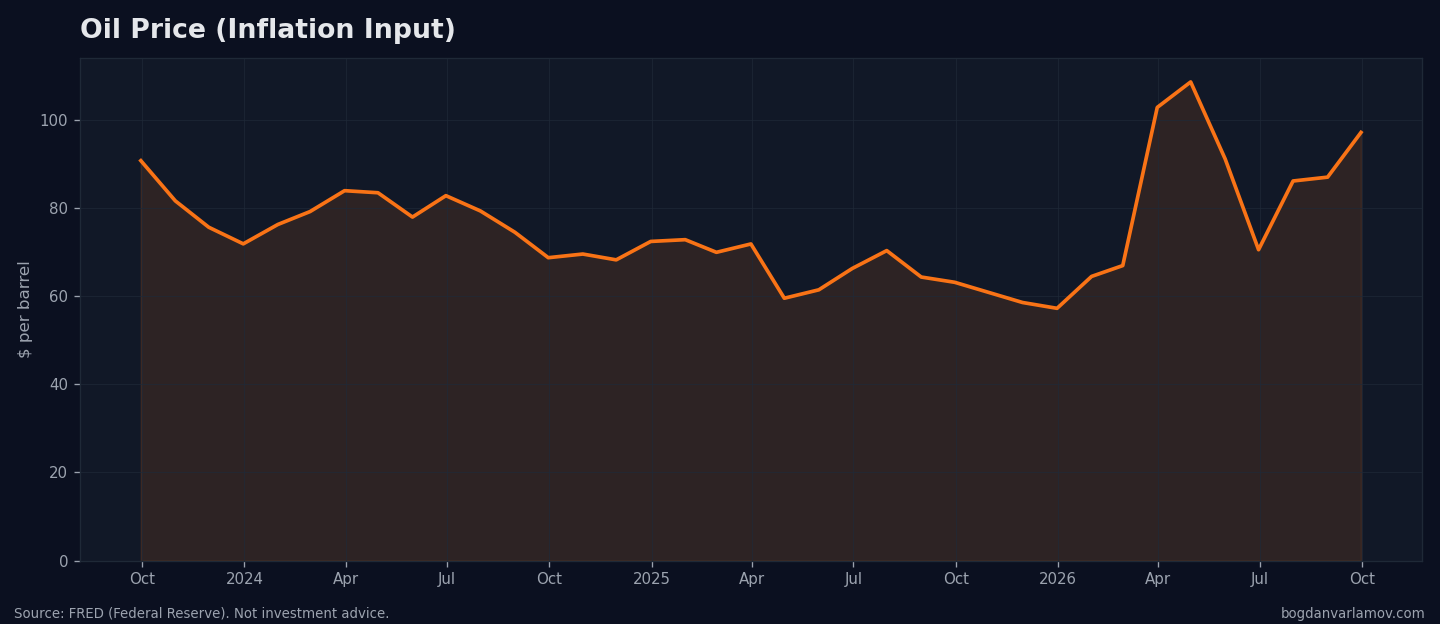
Inflation rose again. Headline CPI rose to 3.7% in September (from 3.5% three months ago and up from 3.0% a year ago), and the 3-month annualized run rate jumped to 4.6% (from 2.8% three months ago). Core CPI is steadier at 2.6% (flat from three months ago, down from 3.0% a year ago). Energy drives the rise. Oil climbed again to near $97 from ~$71 in June and lifted the headline numbers with it.
Rates and the Fed
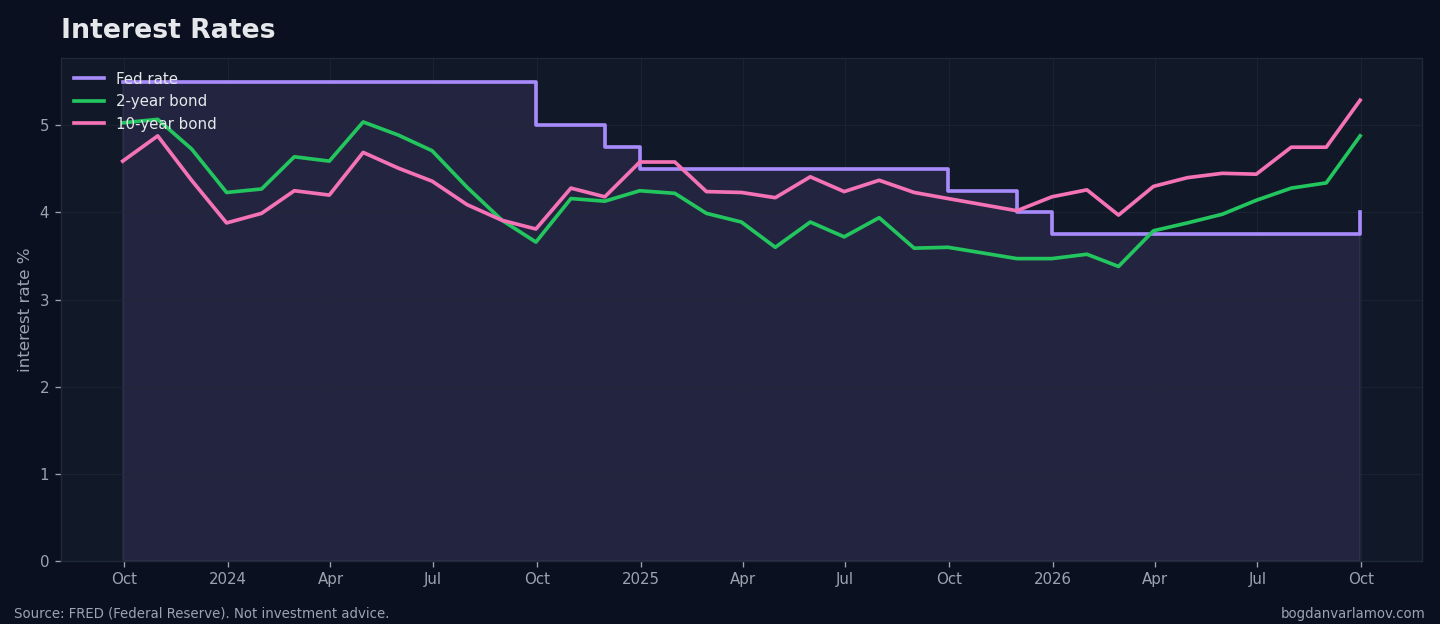
The Fed rate against the 2- and 10-year bond.
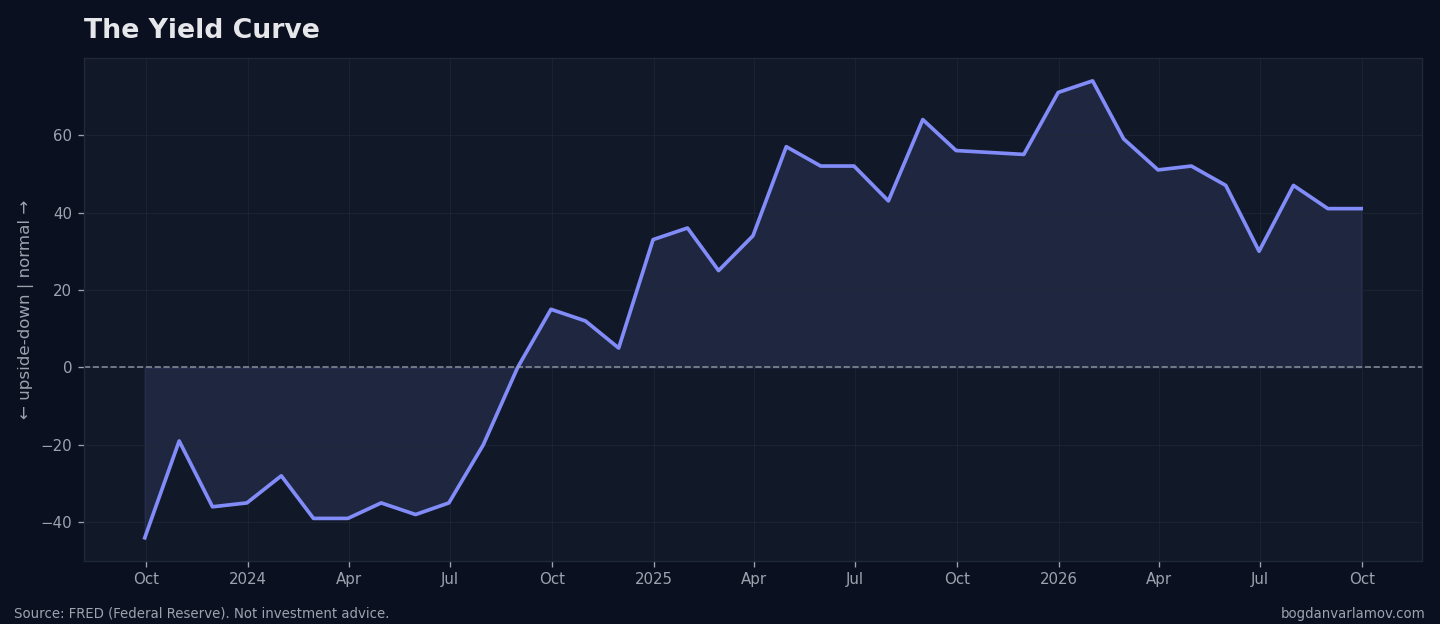
The yield curve (10-year minus 2-year).
The 30-year mortgage rate, where higher rates reach households.
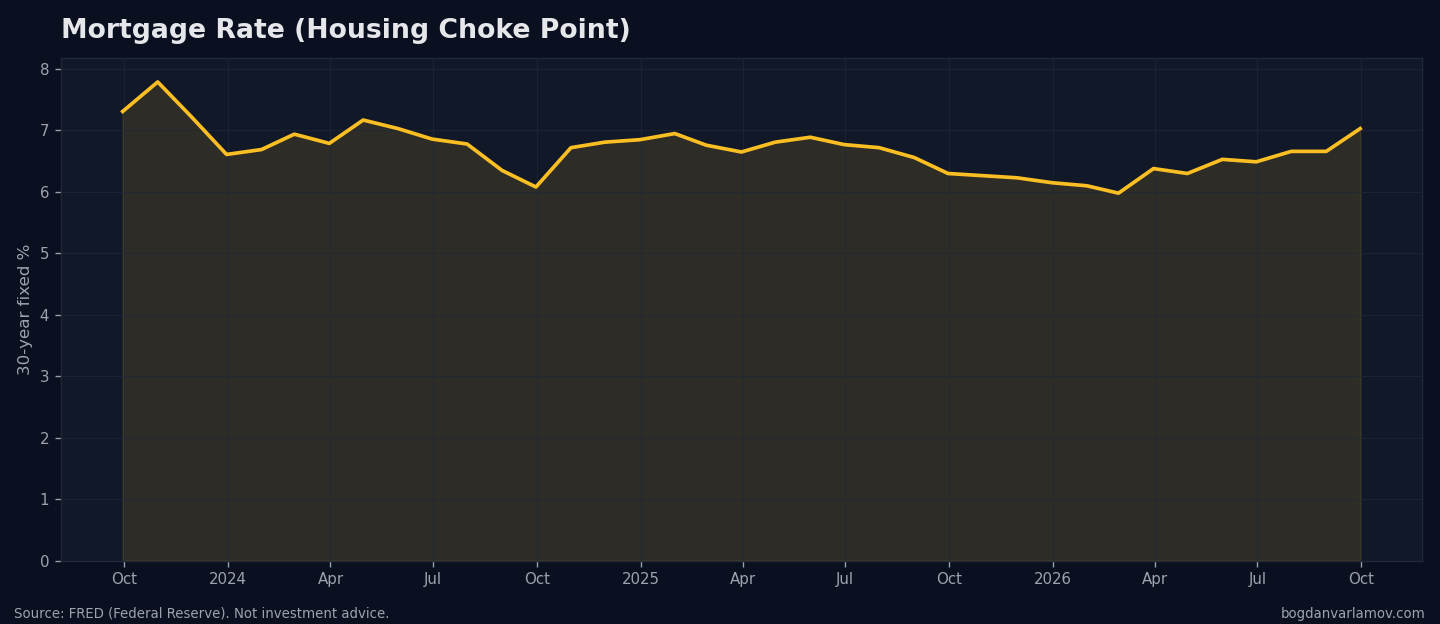
Rates and the Fed are the main story. The Fed lifted its target to 4.00% (from the 3.75% hold earlier this year). The 2-year yield climbed to 4.88% (from 4.14% three months ago) and the 10-year yield climbed to 5.29% (from 4.44%). The two yields moved roughly 75-85bp in one quarter. The 10y-2y curve stays positive at +41bp (up from +30bp three months ago, down from +56bp a year ago) and is not inverted.
The labor market
Unemployment.
Weekly jobless claims, the fastest job-market signal there is.
The labor market is soft, with no sharp break. Unemployment is 4.2% (unchanged from three months ago, down from 4.4% a year ago), and payrolls were a thin +29k in September after August's +133k. Participation held at 61.8%. The Sahm rule has not triggered. The 3-month unemployment average (~4.17%) sits only marginally above its recent low.
Forward-looking stress gauges
High-yield credit spreads, the fear gauge for lenders.
Consumer sentiment, which leads spending.
GDP growth, the last of these figures to arrive.
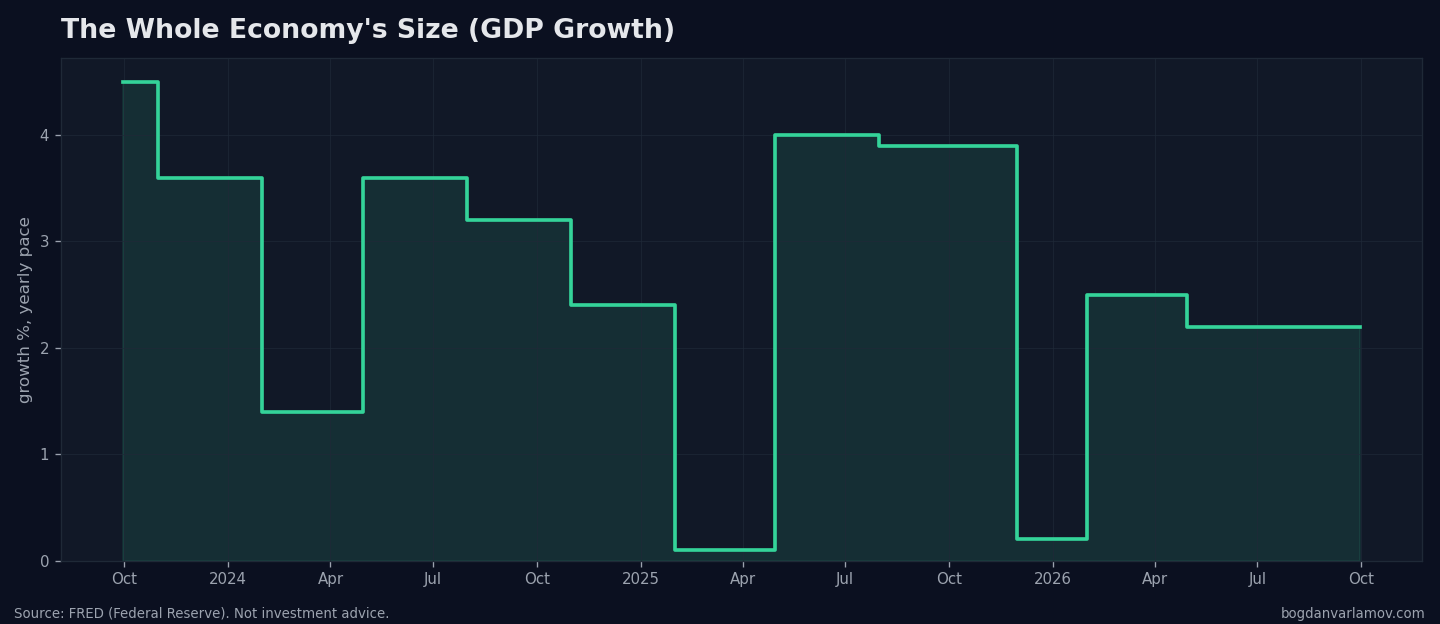
Forward-looking stress gauges stay calm. Weekly jobless claims are low at 200.5k (down from ~222k three months ago and well below the ~260k tripwire). High-yield credit spreads rose slightly to 3.1% (from 2.8% three months ago). The direction deserves attention. The level is still far short of the 4-5% zone that signals real financial stress.
The current soft patch comes from higher rates and energy prices. Credit and the labor market do not show a downturn.
The next twelve months
The model puts rough odds on each path below. The odds are the model's judgment.
Base case (~55%) - Muddle-through / soft landing. Growth stays positive and subdued (GDP last printed 2.2%), and the labor market cools slowly. Inflation is the risk to this case. The 3-month annualized run rate jumped again to 4.6% on the oil spike. Near-term headline prints will likely rise, and the Fed, now at 4.00%, has little room to ease. Low claims and a still-positive curve support this case. The path to 2% inflation now depends heavily on a fall in oil prices.
Bear case (~30%) - Consumer-led / rate-squeeze recession. In this case, higher rates (2y near 4.9%, mortgage 30y ~7.4%) hurt households more. Hiring slows further from the +29k September print. Unemployment climbs toward ~4.6-4.8%, and the Sahm rule triggers. The tripwires for this case are jobless claims above ~260k and a re-inverted curve. Neither tripwire is close today (claims 200.5k, curve +41bp), so the bear case needs fresh deterioration beyond current trends. The gradual rise in credit spreads (2.8% → 3.1%) is the first faint sign of this case.
Bull case (~15%) - Re-acceleration. In this case, oil drops below ~$90, the rise in inflation reverses toward 2%, the Fed stops at 4.00% and resumes cuts, and cheaper credit revives housing and sentiment. The renewed oil climb to ~$97, the jump in the 3-month inflation run rate, and the Fed's move to 4.00% all work against the bull case for now. The bull case needs oil and inflation to fall first.
What to watch next
These tripwires would change the call:
- The yield curve re-inverts (10y-2y back below 0). The curve is +41bp now and steeper than three months ago. Re-inversion is the earliest recession trigger and is not close.
- Weekly jobless claims rise above ~260k and stay there. Claims are 200.5k now and trend down. A rise above ~260k would be the earliest sign of labor weakness, and claims are not close.
- The Sahm rule triggers: the 3-month unemployment average rises 0.5pp above its 12-month low. The average is ~4.17% now, with no meaningful gap yet.
- Oil stays above ~$95. Oil is ~$97 now. Oil already pushed the 3-month inflation run rate to 4.6% and is the main near-term swing factor.
- Credit spreads rise through ~4-5%. Spreads are 3.1% now and rise slowly from their lows. A move through that zone would signal the start of financial stress.
The fine print
The analysis above is a probabilistic reading of lagging and leading indicators. It does not predict the outcome. Since the pandemic, several of these signals have misfired (notably the 2022-24 curve inversion). A drop in the participation rate can also make the unemployment number look better than it is.
The energy-driven jump in inflation is new this quarter, and it arrives with the Fed at 4.00%. Together, higher inflation and a 4.00% Fed rate tighten financial conditions and narrow the room for a soft landing. A re-inverted curve together with a triggered Sahm rule is still the cleanest recession confirmation. Neither signal is active today.
I build these charts from FRED data with my own open pipeline. This is not investment advice.